
 expressing a pod borer insecticidal protein")
Development of a green tissue-specific, insect resistance syn cry1Ab and cre line in pigeon pea
Generation of the cry1Ab line
To achieve sustainable resistance against the lepidopteran insect pest H. armigera, the synthetically prepared bioactive core element of the cry1Ab gene of B. thuringiensis was expressed in pigeon pea. The toxin protein was expressed in a tissue-specific manner and showed insecticidal potency against H. armigera under laboratory conditions. The results are elaborated in the following section.
Generation of pLBRCAb transgenic pigeon pea lines harbouring the syn cry1Ab transgene
The cotyledonary node of the Asha variety was cocultivated with A. tumefaciens EHA105 harbouring the pLBRCAb vector, with three experimental attempts. Agrobacterium-mediated transformation and regeneration were performed following the established protocol reported by Sarkar et al17. Transformed regenerated plants were selected using medium containing bialaphos (4 mg/L) as a selection agent. Under selection pressure, ~ 16% of the regenerated plants showed resistance to bialaphos and further developed into healthy plants after 50 days of recovery. Surviving plants were rooted under selection pressure.
Transformation efficiency of T0 transformants
Drug-resistant T0 plants were further analysed by dot blot to determine the transformation efficiency of the transformed genes. For this, three sets of experiments were performed, wherein a total of 27 plants (T0) showed resistance against the selection medium out of 300 infected explants. Among these 27 plants, 10 showed positive results for the dot blot analysis, indicating 3.33% transformation efficiency (Table 1).
Progeny analysis of transgenic pigeon pea lines harbouring syn cry1Ab
Out of several putative transformants generated using pLBRCAb, only 7 healthy plants were selected for further analysis after stringent screening. Six individual progenies of each of the 7 T0 plant lines (total 42 plants) were randomly selected to carry out dot blot hybridization. Among these plants, 5 (SA3, SB6, SC1, SC3, and SD1) showed positive results (Fig. 1a). Densitometry analysis of dot blots was also carried out by ImageJ software (Fig. 1b) for comparison with the positive and negative controls. SD1 and SC1 plants showed the highest and lowest intensity, respectively. Furthermore, the presence of the cry1Ab gene in the T1 generation was confirmed by Southern blot analysis (Fig. 2a). Of these 5 individual transformants selected through dot blot analysis, 4 plants contained cry1Ab based on Southern blot analysis, among which 2 showed a single integration and 2 showed a double integration of the cry1Ab gene, while the untransformed control plant did not show any band. This experiment provided evidence of stable integration of the transgene and its transfer to consecutive generations.
(a) Dot blot hybridization of the cry1Ab gene in the T1 generation: Six randomly selected T1 plants from 7 individual events (T0 plants) were analysed. A replica blot of the genomic DNA of 42 individual plants was prepared and hybridized with the 800 bp PCR amplified cry1Ab gene as the probe. In this replica blot, SA3, SB6, SC1, SC3, and SD1 showed a positive result, where –C is the untransformed control and + C is the positive control. (b) Graphical representation of the densitometry analysis of dot blots with two replicas by ImageJ Software (Version: 1.50, https://imagej.nih.gov/ij/download.html).
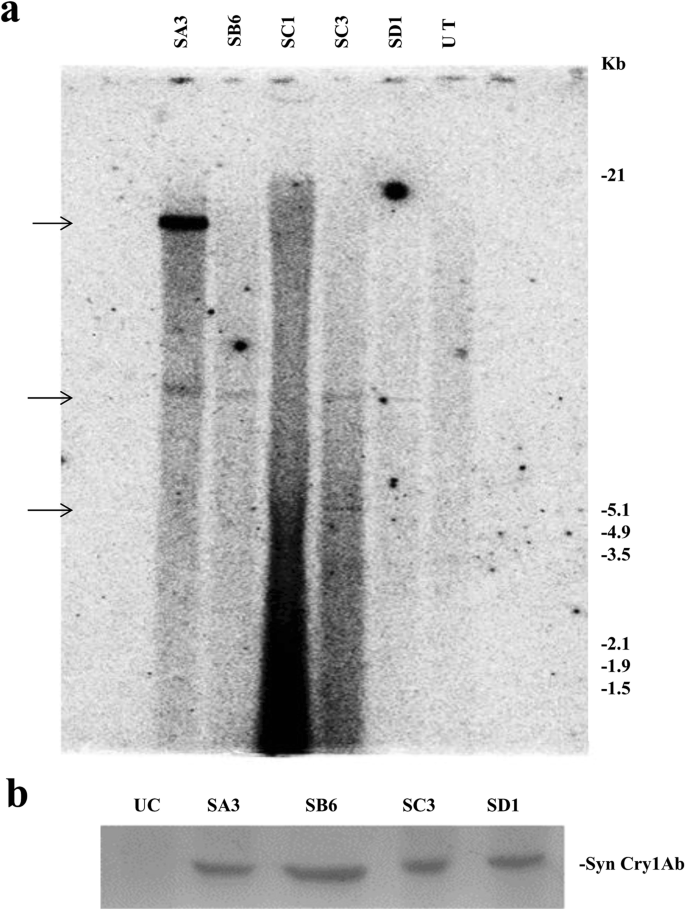
(a) Southern blot hybridization of the cry1Ab gene in the T1 generation: Genomic DNA of dot blot-positive T1 plants was digested with HindIII. The blot was hybridized with the 800 bp PCR-amplified cry1Ab gene (α-32[P]dCTP labelled)) as the probe. Lanes labelled SB6 and SD1 showed a single integration, SA3 and SC3 show a double integration, and UT shows the untransformed control. Approximate molecular weight markers are indicated. (b) Western blot analysis of the Syn Cry1Ab toxin protein in T1 progeny plants with the anti-Cry1Ab antibody: Lane UC: Untransformed control. Lanes SA3, SB6, SC3, and SD1: Transgenic lines.
Expression analysis of the syn cry1Ab gene in T1 transgenic lines
All four Southern-positive transgenic pigeon pea lines of syn cry1Ab (SA3, SB6, SC3, and SD1) were subjected to expression analysis. Expression of the syn cry1Ab gene in four transgenic lines was analysed using an anti-Cry1Ab antibody by western blot (Fig. 2b); distinct bands were observed in all plants. No Cry1Ab protein band was observed in the untransformed control line.
Entomocidal activity of Syn Cry1Ab toxin present in the T1 transgenic pigeon pea
Transgenic plants were tested for insecticidal activity. Fully opened young, fresh leaves of four T1 transgenic pigeon pea lines were tested through an in vitro insect feeding bioassay to confirm the insecticidal activity of Syn Cry1Ab toxin against second instar larvae of H. armigera. The young leaves of the untransformed plants were used as a negative control. The transgenic plants showed very little damage after feeding by insects, while massive damage was observed with the untransformed control line (Fig. 3a). Extensive feeding of leaf tissue (> 90%) by the larvae was observed for untransformed control plants, and larvae were healthy, active, and showed regular developmental cycles. Larvae fed on transgenic plants SA3, SB6, SC3, and SD1 showed a 70–90% mortality rate with a 79.1–85.5% bodyweight reduction (Table 2). The gradual decreases in larval body weight after 6 days of incubation in the insect feeding bioassay are graphically presented in Fig. 3b.

In vitro insect (H. armigera) feeding assay: The T1 transgenic plants with 5 replica experiments were carried out with two insects for each individual plant. (a) SA3, SB6, SC3, and SD1 are transgenic plants that showed a positive result, and UT is an untransformed negative control plant. (b) Graphical presentation of insect weight loss during the feeding assay in comparison with the untransformed control.
Segregation analyses of the bar gene in T1 progeny
The segregation pattern of the bar transgene through seeds in the T1 progeny was monitored by germination on the selection medium. Randomly selected seeds of each of the four T0 transformants were screened for germination in 4 mg/l bialaphos-containing medium alongside seeds of untransformed plants. It was observed that some of the T1 seeds did not grow after germination and gradually turned brown in the presence of bialaphos. Most of the T1 seedlings could grow in the presence of bialaphos. The ratio of bialaphos resistant:sensitive seedlings was scored after 4 weeks, and it was observed that the ratio was close to the expected ratio (3:1) in each case, indicating a Mendelian mode of inheritance for the monohybrid cross (Table 3). The plants that survived on the screening medium confirmed the stable inheritance of the bar transgene, whereas the untransformed control plants ceased to germinate and gradually turned brown even after 10 days on the same medium. The germinated plantlets were transferred to pots in the greenhouse for growth and further analysis. Since the bar gene is linked to the cry1Ab gene, the inheritance pattern of the cry1Ab gene is expected to be the same as that of the bar gene.
Generation of cre lines
To eliminate the selectable marker (bar) gene from syn cry1Ab transgenic pigeon pea lines through Cre/lox-mediated recombination, cre pigeon pea lines were generated. To catalyse recombination, crossings were performed between the cre plant line and syn cry1Ab plant line, which carries lox-bar-lox. Finally, superfluous cre and hptII genes were excluded through consecutive genetic segregation. The results are elaborated in the following sections.
Generation of transgenic pigeon pea lines harbouring the cre recombinase gene
The pigeon pea transformants with pHC (H: hptII and C: cre) were generated following the Agrobacterium-mediated pigeon pea transformation protocol in Asha varieties. A total of 270 explants were cocultivated with Agrobacterium EHA105 containing pHC. Only 27 regenerated plants were retrieved after stringent hygromycin selection (50 mg/L) (Table 4). Among them, 13 plantlets showed a cre gene-specific PCR amplification product (275 bp) with cre gene-specific primers (CRFP2/CRRP2) (Supplementary Table S1). Representative PCR amplification of the cre gene is shown in Fig. 4.
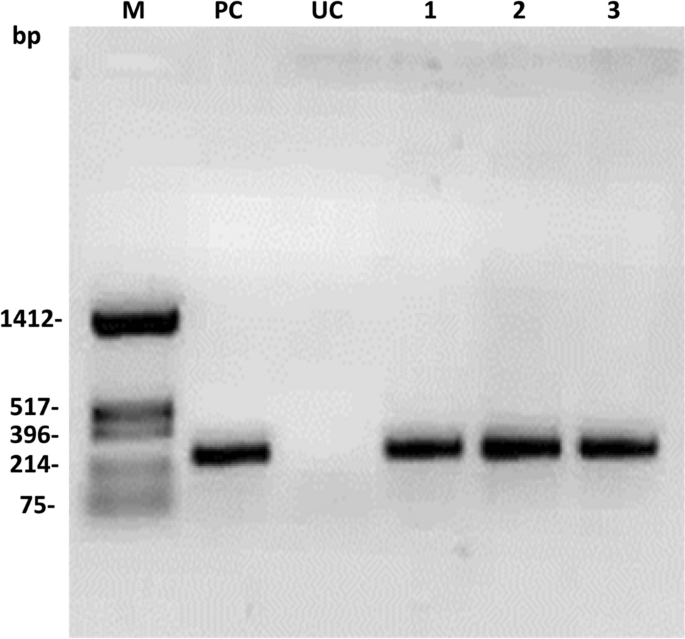
PCR analysis of putative T0 transformants with cre gene-specific primers: UT: Untransformed control, PC: Positive control and M: HinfI digested pUC18 as a molecular weight marker.
Seed transmission of the cre gene through T1 generation and progeny analysis
A containment condition was created to prevent cross-pollination and allow T0 transgenic pigeon pea plants to self-pollinate, and T1 seeds were harvested. T1 seeds from representative transgenic plants were initially screened by growing on antibiotic (50 mg/L hygromycin)-supplemented media. The sensitive seedlings ceased to grow and gradually died, whereas resistant seedlings showed healthy growth. The data regarding transgene (hptII) segregation in T1 progenies were evaluated by the χ2 test. The results showed that the hptII gene segregated closely in a Mendelian fashion with a 3:1 segregation ratio (Table 5).
Southern blot analysis for the confirmation of the presence of the cre gene in the T1 line
The integration of the cre recombinase gene into the pigeon pea transformants was further confirmed by Southern blot analysis. Randomly chosen PCR-positive seeds of transformants grown in the presence of hygromycin selection were selected for Southern blot analysis. The genomic DNA of T1 plants was digested with HindIII restriction endonuclease, and hybridization was performed with an α-[32P] dCTP radiolabelled probe of the cre gene (1202 bp). The developed blot of three transformed lines (CA, CB, and CC) showed transgene integration (Fig. 5a). Among these three plants, the presence of a single insertion of the cre gene was observed in two plants, viz., CB and CC, while double integrations were observed in one plant, viz., CA. No band was detected for the untransformed control (UC) plant.
(a) Southern blot analysis of PCR-positive plants in T1 using the cre gene as the probe. Genomic DNA was digested with HindIII. Lane UC: Genomic DNA from the untransformed control line, and lanes CA, CB and CC: genomic DNA of transformed plants. Approximate molecular weight markers are indicated. (b) Western blot analysis of T1 transgenic lines with the polyclonal Cre recombinase antibody raised in rabbit for the detection of cre recombinase gene expression. Lane UC: Untransformed control. Lanes CA, CB, and CC: Transgenic plant lines.
Western blot analysis of the T1 line to determine the presence of Cre recombinase
The expression of the cre gene was analysed by western blot analysis. Total leaf protein was isolated from these three Southern blot-positive plants (30 days old). The total soluble protein of transgenic plants and untransformed controlled plants was loaded and separated on a 12% SDS-PAGE gel. Upon western blot analysis using the anti-Cre antibody (Product no. ab41104, Abcam, UK), distinct bands were observed in all transgenic pigeon pea plants (Fig. 5b). The three individual plants showed specific expression of the 38 kDa Cre protein. No band was detected in the case of the untransformed control (UC) plant.
Elimination of selectable marker genes from syn cry1Ab pigeon pea lines through Cre/lox-mediated recombination and consecutive genetic segregation
Crosses between T1
syn cry1Ab and cre lines
To initiate the crossing between T1 syn cry1Ab and cre lines for the production of marker-free insect-resistant pigeon pea, we first identified the appropriate time of crossing. The outcomes of the findings are discussed in the following sections.
Identification of the appropriate timing for crossing in pigeon pea
Flowers at different stages were collected to observe the morphological development of the stigma and anther in the process of flower development. A flower fully covered with calyx was designated stage zero, whereas blooming of the flower was divided into four stages up to fully bloomed, depending upon the morphological appearance (Supplementary Fig. S3). The anther and stigma of the respective stages of flower development were separated and observed under a microscope. The stagewise development of anthers and stigmas and their functions are represented in Supplementary Fig. S4. In the present observation, it was found that stigma at stage 3 (Supplementary Fig. S4, 3a) had the highest pollen receptivity. In stage 2 (Supplementary Fig. S4, 2b), it was observed that the anthers started to release pollen, and no pollen was attached to the stigma (Supplementary S4, 2a) until that time. Stage 2 was found to be an appropriate stage for the emasculation of the anther, as it begins to open for discharging pollen. Stage 3 (1–3 PM) is also suitable for pollination in the emasculated flower; in this stage, stigmas show the highest pollen receptivity and become sexually active for fertilization. After that, the receptivity of the stigma decreases continuously over time.
The crossing of parental pigeon pea lines and screening of hybrid plants
Two independent T1 progeny plants (SB6 and SD1) harbouring pLBRCAb [considered the female parent (♀)] were crossed with a T1 progeny plant (CC) harbouring pHC [considered the male parent (♂)] with moderate cre gene expression. The hybrid progenies obtained from the cross between T1 pHC and the pLBRCAb line were named T1F1. The consecutive generation of the hybrid line was designated T1F2. All the seeds of two independent crossing experiments were harvested, air-dried, and stored. The hybrid seeds were surface sterilized and germinated on MS medium in the presence of 50 mg/L hygromycin. Drug-resistant seedlings were transferred to the greenhouse and allowed to grow to maturity for further detection of selectable marker gene (bar) elimination.
PCR-based analysis of marker gene elimination following Cre/lox-mediated recombination
The T1F1 seeds (SB6CC) were collected separately from two independently crossed events (Table 6) and germinated on selection medium containing hygromycin (50 mg/L) to eliminate possible azygous plants for hptII and the linked cre transgene. Forty-two hybrid seeds from the SB6CC line were randomly selected for initial hygromycin screening. Among the hybrid seeds, 21 seeds grew into plantlets under selection pressure (Table 6). These initially screened hybrid plants were further screened (verified) by separate PCRs with cre, syn cry1Ab, and bar gene-specific primer pairs. The representative data from hybrid line SB6CC are shown in Fig. 6a–c. Among these 21 progeny plants, 14 plants were found to be positive for both cre and syn cry1Ab genes; 7 plants were positive for only the cre gene (Fig. 6a,b). As expected, no plant harbouring only the syn cry1Ab cassette was obtained, as these plants did not contain the hptII gene and thus were excluded from the screening process. Marker gene elimination among the 14 syn cry1Ab- and cre-positive hybrid plants of SB6CC was further verified through PCR using bar gene-specific primers (Fig. 6c). This PCR result showed five bar-negative plants, as the bar gene was expected to be eliminated through recombination due to the presence of the cre recombinase gene. Based on this finding, the frequency of Cre/loxP-mediated recombination was calculated to be 35.71% in the case of hybrid line SB6CC. Similarly, the other hybrid line SD1CC showed a 33.33% recombination frequency, with an average recombination frequency for these two lines of 34.52%.
PCR analysis of the 21 T1F1 hybrid line for Cre-mediated bar gene elimination. (a) PCR amplification of hygromycin-selected progenies of line SB6CC with cre-specific primers. Lane PC: PCR from the pHC plasmid as a positive control; lanes 1–21: 21 T1F1 hybrid progenies. The 275 bp amplicon represented the cre recombinase. (b) PCR with syn cry1Ab-specific primers of 21 cre-positive plants of the T1F1 hybrid line SB6CC. Fourteen plants showed amplification of a representative 720 bp region of the syn cry1Ab gene. Lane PC: pLBRCAb as a template. (c) PCR with bar-specific primers of 14 syn cry1Ab- and cre-positive plants of the SB6CC line. Lanes 1–14: T1F1 hybrid plants, where plants no. 2, 5, 11, 18 and 19 showed the absence of bar. Lane PC: PCR from pLBRCAb; the 552 bp amplicon represents the bar gene. Plant lines boxed in black show successful elimination of the bar gene. Lane M in (a), HinfI-digested pUC18 DNA as a molecular weight marker. Lane M in (b) and (c), GeneRuler 1 kb DNA Ladder, Thermo Scientific. Lane UC represents PCR results from the genomic DNA of an untransformed plant. All figures of each independent gel are separated by a white border.
Establishment of completely selectable marker-free T1F2 transgenic pigeon pea plants
As the bar-negative T1F1 plants are cre positive, there is a high possibility that they still bear hptII as a linked gene. PCR-based screening with hptII gene-specific primers supported this fact (Fig. 7). Consequently, some of the T1F1 plants underwent self-fertilization to obtain T1F2 progeny plants and were analysed for complete excision of selectable marker genes through genetic segregation. Twelve T1F2 progenies of the bar-negative line SB6CC (19) were analysed for the presence of syn cry1Ab, cre, and hptII genes. Six plants [T1F2 plant SB6CC (19)- 1, 4, 5, 9, 10,12] contained syn cry1Ab, cre and hptII genes, three plants [SB6CC (19)- 2, 6, 8] showed the presence of cre and hptII, and three plants [SB6CC- 3, 7, 11] were found to contain only syn cry1Ab without the presence of the cre or hptII gene (Fig. 8a,b,c). Thus, the elimination of the selectable marker gene (hptII) and linked transgene (cre) in T1F1 plants was performed by genetic segregation in the consecutive generation (T1F2). Therefore, these three identified pigeon pea plants are now considered completely marker-free transgenic syn cry1Ab lines.
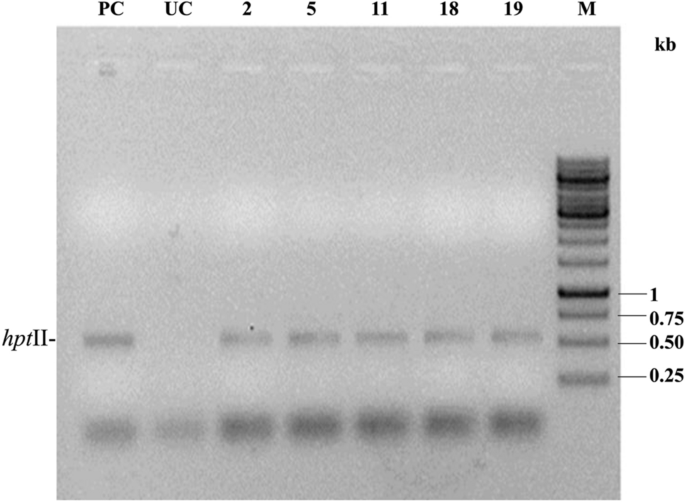
PCR analysis of the five T1F1 bar-negative, cre-positive plants with hptII gene-specific primers. PC: Amplification of pHC as a positive control; UC: Untransformed control. M: GeneRuler 1 kb DNA Ladder, Thermo Scientific.
PCR analysis of 12 randomly selected bar-negative SB6CC T1F2 plants to establish complete elimination of the cre-hptII gene. (a) PCR with syn cry1Ab-specific primers, (b) PCR with cre-specific primers, and (c) PCR with hptII-specific primers. PC: positive control (amplification from syn cry1Ab or cre gene containing expression constructs); UC: no amplification from the untransformed control line. MF (Marker Free): represents T1F2 plants with complete elimination of all the selection markers (bar) and redundant transgenes (cre-hptII linked gene) with retention of the toxin gene. M HinfI-digested pUC18 as a molecular weight marker.
Finally, the insecticidal activity of Syn Cry1Ab toxin in T1F2 marker-free transgenic plants of the SB6CC line was analysed by an in vitro insect feeding assay. In this experiment, young transgenic leaves were incubated with second instar larvae and compared with insects fed untransformed control leaves. The transgenic plants showed very little damage, while massive damage was observed for the untransformed control line (Fig. 9). Extensive feeding of leaf tissue (> 90%) by the larvae was observed for the untransformed control plants, and all the larvae were healthy, active, and showed regular developmental cycles. Larvae fed on transgenic plants SB6CC(3), SB6CC(7), and SB6CC(11) showed > 90% mortality rates with drastic body weight reduction. The data were collected after 6 days of incubation in an insect feeding bioassay.

In vitro insect (H. armigera) feeding assay of T1F2 marker-free transgenic plants of the SB6CC line: Transgenic plants with 3 replica experiments were carried out by second instar larvae for each individual plant. Insect feeding assay of SB6CC(3), SB6CC(7) and SB6CC(11) transgenic plants with two insects showed a positive result; UC is an untransformed control plant (leaf), and the white arrow shows live and healthy larvae.


